In order to access the EIS Delivery Dashboard feature from the menu, click on the EIS Delivery Dashboard tile on the 'Home' screen or click on the EIS Delivery Dashboard tile in the 'Views' menu.
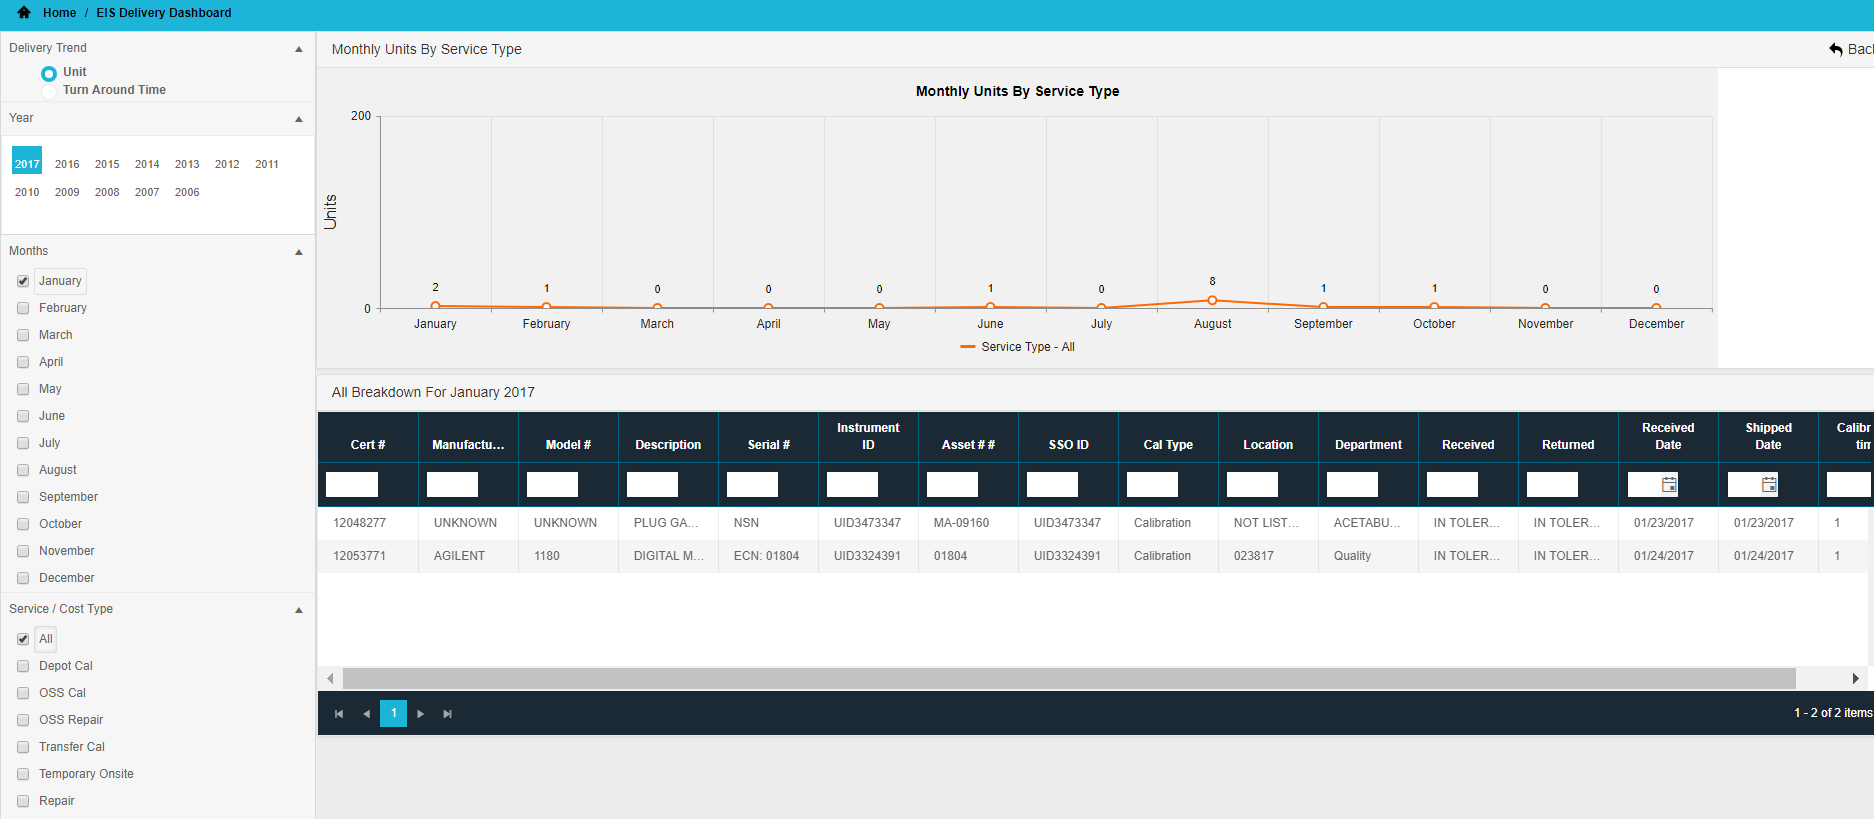
This screen shows the number of units each month per service type.
This screen shows the number of units each month per service type. The grid shows a breakdown of each asset and can be downloaded to excel.
This screen shows the percentage of units each month meeting the commitment time by service type.
This screen shows the percentage of units each month meeting the commitment time by service type. The grid shows a breakdown of each asset and can be downloaded to excel.